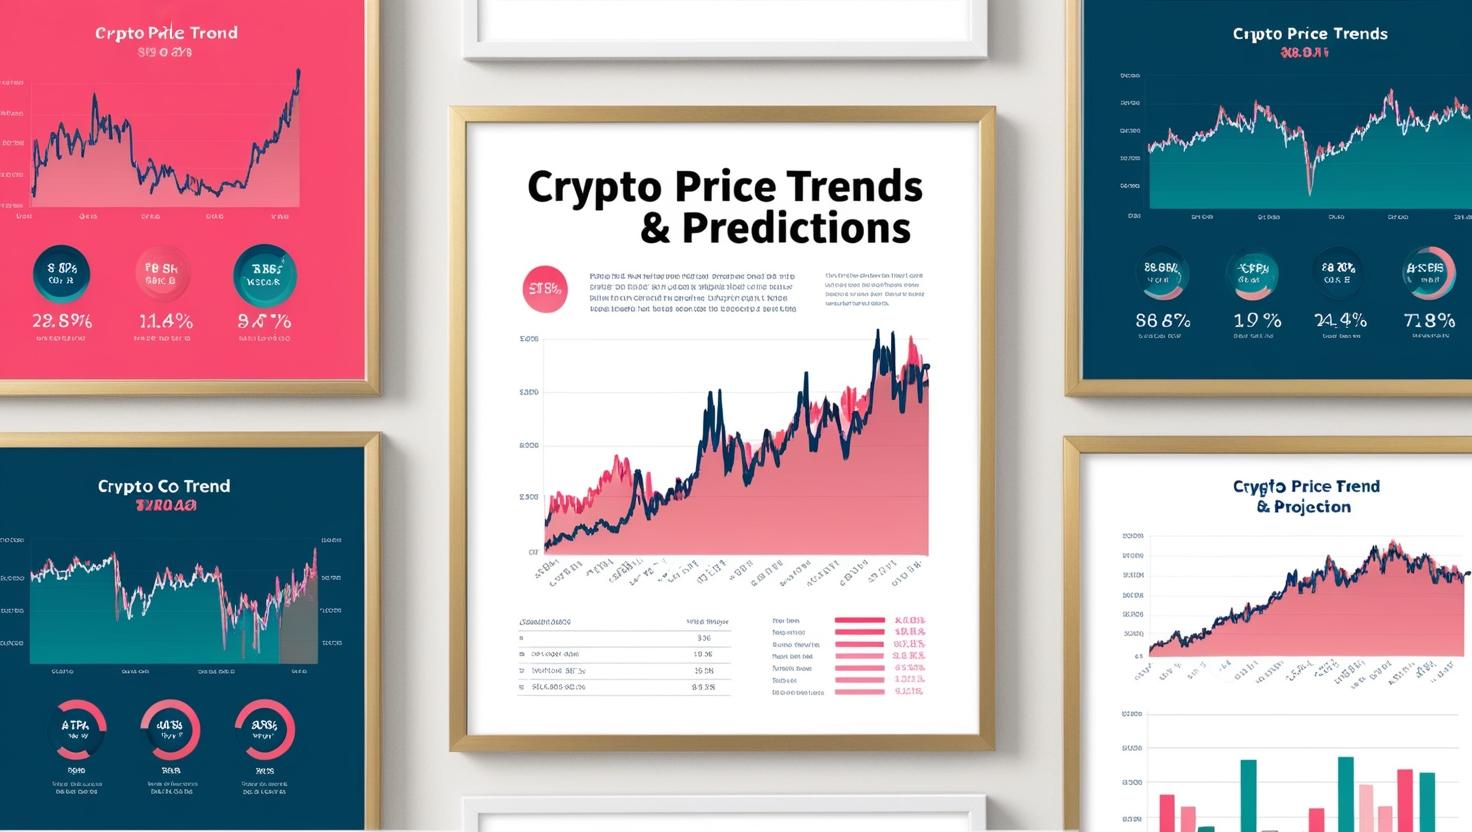
Crypto price trends and predictions
Understanding crypto price trends and predictions is like learning to read a story that numbers tell us about how things cost and how their prices might change in the future. Let’s explore this concept in a way that’s easy to grasp.
What Are Price Trends?
A price trend shows the general direction in which the price of something, like a toy, a video game, or even a stock, is moving over time. There are three main types of price trends:
- Upward Trend (Bull Market): Prices are going up over time. Imagine the cost of your favorite action figure increasing each month.
- Downward Trend (Bear Market): Prices are going down over time. Think of a video game that becomes cheaper as new versions come out.
- Sideways Trend (Flat Market): Prices stay about the same over time, without significant increases or decreases. It’s like the price of a comic book that doesn’t change much over the years.
Why Do Prices Change?
Prices change due to various factors:
- Supply and Demand: If many people want something (high demand) but there’s not much of it available (low supply), the price goes up. Conversely, if there’s a lot available but not many people want it, the price goes down. Read: (Updated 2025) Guide to Crypto Basics for Beginners
- Market Sentiment: This is how people feel about the market. If investors are optimistic, prices may rise. If they’re worried, prices might fall.
- Economic Indicators: Things like employment rates, inflation, and economic growth can influence prices.
How Do We Predict Price Trends?
Predicting price trends involves analyzing past and present data to guess where prices might go in the future. Here are some common methods:
- Technical Analysis: This involves studying charts and patterns of past prices to predict future movements. It’s like looking at the history of a video game’s price to guess if it will go on sale soon.
- Fundamental Analysis: This looks at the overall health of a company or economy to determine the value of its stocks or products. For example, if a toy company releases a popular new line, its stock price might go up.
- Sentiment Analysis: This examines how people feel about a market or product by analyzing news, social media, and other sources. If everyone is excited about a new movie, merchandise prices might increase.
 Tools Used in Predicting Price Trends
- Charts and Graphs: Visual representations of price movements over time.
- Moving Averages: These smooth out price data to identify trends by averaging prices over a specific period.
- Indicators: Tools like the Relative Strength Index (RSI) help determine if an asset is overbought or oversold.
Challenges in Predicting Prices
Predicting prices isn’t always accurate because:
- Market Volatility: Prices can change rapidly and unpredictably.
- Unexpected Events: Natural disasters, political events, or sudden news can impact prices.
- Emotional Reactions: People’s emotions can lead to unpredictable buying or selling.0
For a visual explanation of how prices can change, especially with everyday items like food, you might find this video helpful: https://youtu.be/3dwJYArFsVc
Why Is Understanding Price Trends Important?
Knowing about price trends helps in making informed decisions, such as:
- Investing Wisely: Buying stocks or products when prices are low and selling when they’re high.
- Budgeting: Planning purchases based on expected price changes.
- Avoiding Scams: Recognizing when a price trend seems unnatural or manipulated.
Conclusion
Understanding price trends and predictions is like having a map that guides you through the world of buying and selling. By learning to read this map, you can make smarter choices with your money and investments.
